This Chart Analysis Hints at Polkadot (DOT) Gearing Up for a New High—Here’s the Outlook


DOT is showing promising price movement following a breakout from a key chart pattern. However, DOT’s price has been looking good on the daily chart lately, with signs pointing to more upside ahead based on what’s in the charts.
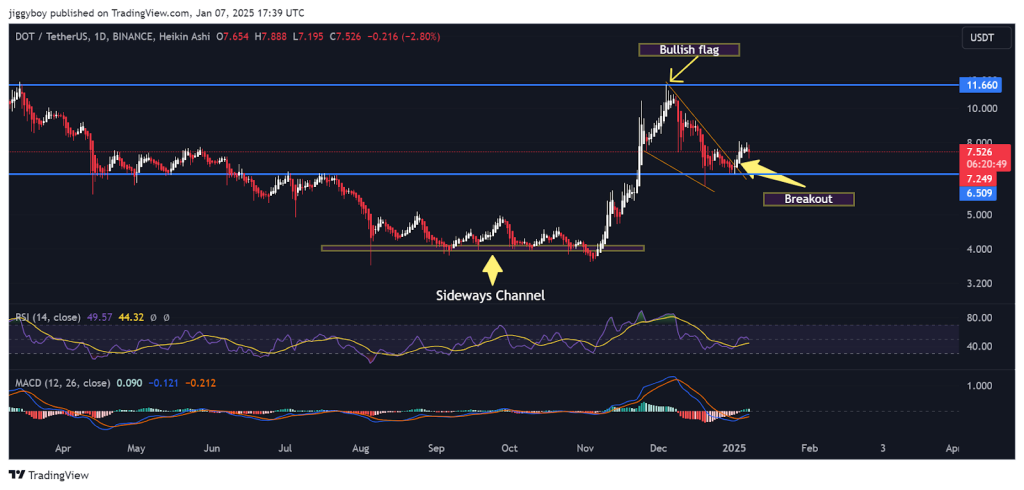
From April to October, DOT was stuck moving sideways. The price kept bouncing between $5.50 and $6.00 at the bottom and around $7.50 at the top. But then something interesting happened in October—the price finally broke free from this range and shot up fast, reaching almost $11.66.
This breakout from the sideways pattern tells us buyers are taking control, and we might see prices keep climbing from here.


Following the rally, the DOT chart displayed a bullish flag pattern. This formation is characterized by descending parallel lines, suggesting temporary consolidation before a continuation of the uptrend.
A breakout from this flag pattern has occurred, but the price of DOT is currently retesting the breakout zone near $7.25–$7.50. Such retests are common in price action, providing opportunities to confirm support levels before further moves.
Polkadot Support and Resistance Zones to Watch
Polkadot’s immediate support is between $7.25 and $7.50, with $6.50 acting as a secondary level. These zones are crucial in determining whether the bullish trend will hold. On the resistance side, $11.66 represents the next major target if the price continues its upward trajectory.
The current price action reflects a balance between bullish and bearish forces. Holding above the $7.25–$7.50 range may pave the way for Polkadot to aim for its recent high while losing this zone could lead to a pullback to $6.50.
Read Also: Hedera Price Breakout Signals Potential for Further Gains – Could HBAR See a 37% Upside?
Indicators Show Mixed Signals
The RSI, currently at 44.32, suggests neutral momentum. It is below 50, indicating a slight bearish tone but still within acceptable retracement levels. The MACD shows the line slightly below the signal line, reflecting slowing bullish momentum. A potential crossover above the signal line could reignite bullish sentiment.
The medium-term trend for Polkadot’s price remains bullish, with higher highs and higher lows supporting the structure. However, the short-term trend leans neutral due to the retest phase and consolidation following the breakout. Traders will likely focus on whether Polkadot sustains its support levels to determine the likelihood of a move toward $11.66.
Follow us on X (Twitter), CoinMarketCap and Binance Square for more daily crypto updates.
Get all our future calls by joining our FREE Telegram group.

We recommend eToro
Active user community and social features like news feeds, chats for specific coins available for trading.
Wide range of assets: cryptocurrencies alongside other investment products such as stocks and ETFs.
Copy trading: allows users to copy the trades of leading traders, for free.
User-friendly: eToro’s web-based platform and mobile app are user-friendly and easy to navigate.


